Introduction to induced pluripotent stem cell toxicity - Molecular Devices SpectraMax I3
Advantage:
1. Simple and rapid cytotoxicity screening of 96 or 384-well plates by detecting cell adherence area
2. Follow the simple process of a general micro-hole reader
3. Have cell image data to increase data credibility
Drug-induced tissue toxicity is an important reason why drug candidates fail to enter the market. Therefore, highly predictive analysis of safety and efficacy tests is the key to improving drug development and reducing drug resistance. Human induced pluripotent stem cell (iPSC)-derived hepatocytes and neurons exhibit typical characteristics and metabolic mechanisms of adult cells and are ideal for high-content screening in early drug development.
Although standard cytotoxicity assays using fluorescent and chemiluminescent readers are well known, more useful information can be obtained if actual cell observations are performed using a cell imaging counter.
Get more information with standard viability experiments
Cell viability dyes, such as Calcein AM, can be used to test the toxicity of total compounds in living cells. Calcein AM emits green fluorescence only in living cells that exhibit esterase activity. Human hepatocytes derived from iPSC were first treated with different compounds for 24 hours and then stained with Calcein AM; live cell images were acquired using the SpectraMax® MiniMaxTM Imaging Cytometer (a upgrade option for the SpectraMax® i3 Multi-Function Detection Platform). The green cytoplasmic region in live cells was identified using the Cell Proliferation Analysis Module in SoftMax® Pro software (Figures 1 and 2), and IC50 values ​​were calculated directly using the curve fit function in the software (Figure 3).
Figure 1. Live cell detection of viability dyes
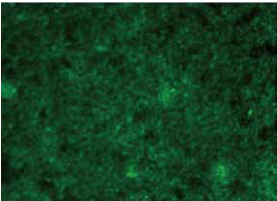
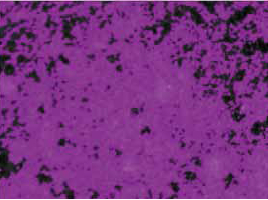

Live cells stained with Calcein AM were identified using the Cell Proliferation Assay module in the SoftMax Pro software, which was used to calculate the percentage of the area covered by the living cells. The purple masks on the right show the distribution of living cells, which can be observed in the picture on the left.
Figure 2. Rapid detection of cell proliferation rate
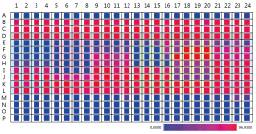
In hepatotoxicity experiments, it is possible to quickly show which compound is cytotoxic by heat map data. The red holes are the most adherent to the cells, while the blue holes are the least adherent. The EH row is the most cytotoxic, and the A and MP rows are cell-free.
Figure 3. Compound IC50 values ​​are given by curve fitting

The IC50 values ​​of four different compounds were determined using the curve fitting function of SoftMax Pro software.
Neurons
The toxicity of neurons is manifested in a decrease in the number or a decrease in the length of the synapse (even in the case of not affecting the number or viability of the cells). Imaging experiments can not only detect the body of neuronal cells, but also detect axons and dendrites of neuronal cells, providing more information on cell growth.
iPSC-neuron cells were seeded at 5,000 cells/well in 384-well plates for 5 days, then retinoic acid diluted 1:2, four wells were ligated, treated for 24 hours, then cells were fixed and AlexaFluor 488 was used. Labeled tubulin antibody staining.
More than 2000 cells can be observed per observation field, close to 30% of the pore area, and then analyzed using the Cell Count Analysis Module in SoftMax Pro software (Figure 4).
More information on toxicity experiments
The SpectraMax MiniMax Cell Imaging System provides cell image data and cell morphology information that complements the plate reader's fluorescence-only microplate data. Other parameters such as cell count, cell density, etc. are of great value in evaluating the iPSC hepatocyte or neuronal cytotoxicity of the compound.
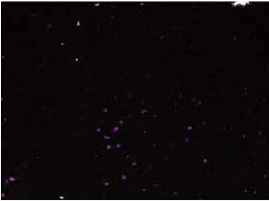
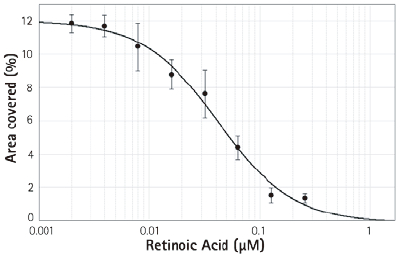
Figure 4. Concentration-dependent inhibitory effect of retinoic acid on neurite outgrowth
cover(%)
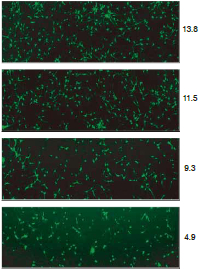
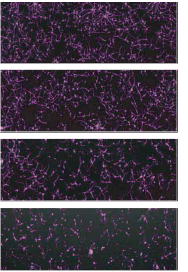
Top: As the concentration of retinoic acid increases (from top to bottom, the first row is the control), the growth of axons decreases. The purple overlay (right column) is the identified cells and axons.
Right: Curve-based cooperation diagram based on concentration and area of ​​the overlay area
In a hydroponic system, plants are placed in nutrient-enriched water. Mediums such as gravels, sand or vermiculite can also be used. Thus plants which are placed in the water absorb the nutrients very easly. When the nutrients from the water starts finishing , water is recycled or additional nutrients are added.
Greenhouse Garden Hydroponics,Hydroponic Garden,Hydroponic Greenhouse
JIANGSU SKYPLAN GREENHOUSE TECHNOLOGY CO.,LTD , https://www.engreenhouse.com